

Salesforce has been teaching us to think in graphs all along. An Account has Contacts, a Contact opens a Case, the Case is about a Product, and that Product is covered by an Entitlement. Somewhere nearby there is an Opportunity, a renewal, a partner, and probably three integrations arguing about the customer’s real ID. Nobody cares about these records one at a time because the useful part is how they connect, and that is the heart of a knowledge graph: it stores the things a business knows, but it also treats the relationships between those things as real knowledge.
That becomes useful when the question is bigger than one object or one report. Consider a service and sales question that sounds perfectly reasonable when somebody asks it in a meeting. It looks simple until somebody tries to identify where the answer actually lives:
Which customers are likely to be affected by this product issue, have an active entitlement, are part of a strategic account, and are already discussing a renewal with us?
There is no “Answer__c” field for that. The answer lives across Accounts, Assets, Cases, Products, Entitlements, Contacts, Opportunities, incidents, and knowledge articles; it is a path, not a row. This article unpacks what a knowledge graph actually is, where it earns its keep, why AI has dragged it back into the spotlight, and why Salesforce developers have more of a head start than we may think. There is no code here and no graph-database sales pitch.
What is a knowledge graph, in plain English?
A knowledge graph is a map of things and relationships that a machine can understand. It does not stop at “Record A links to Record B.” It can express that a person approves purchases for an account, an asset runs a particular product version, or a policy replaced an older policy on a specific date. The label on the connection matters because it gives the link business meaning.
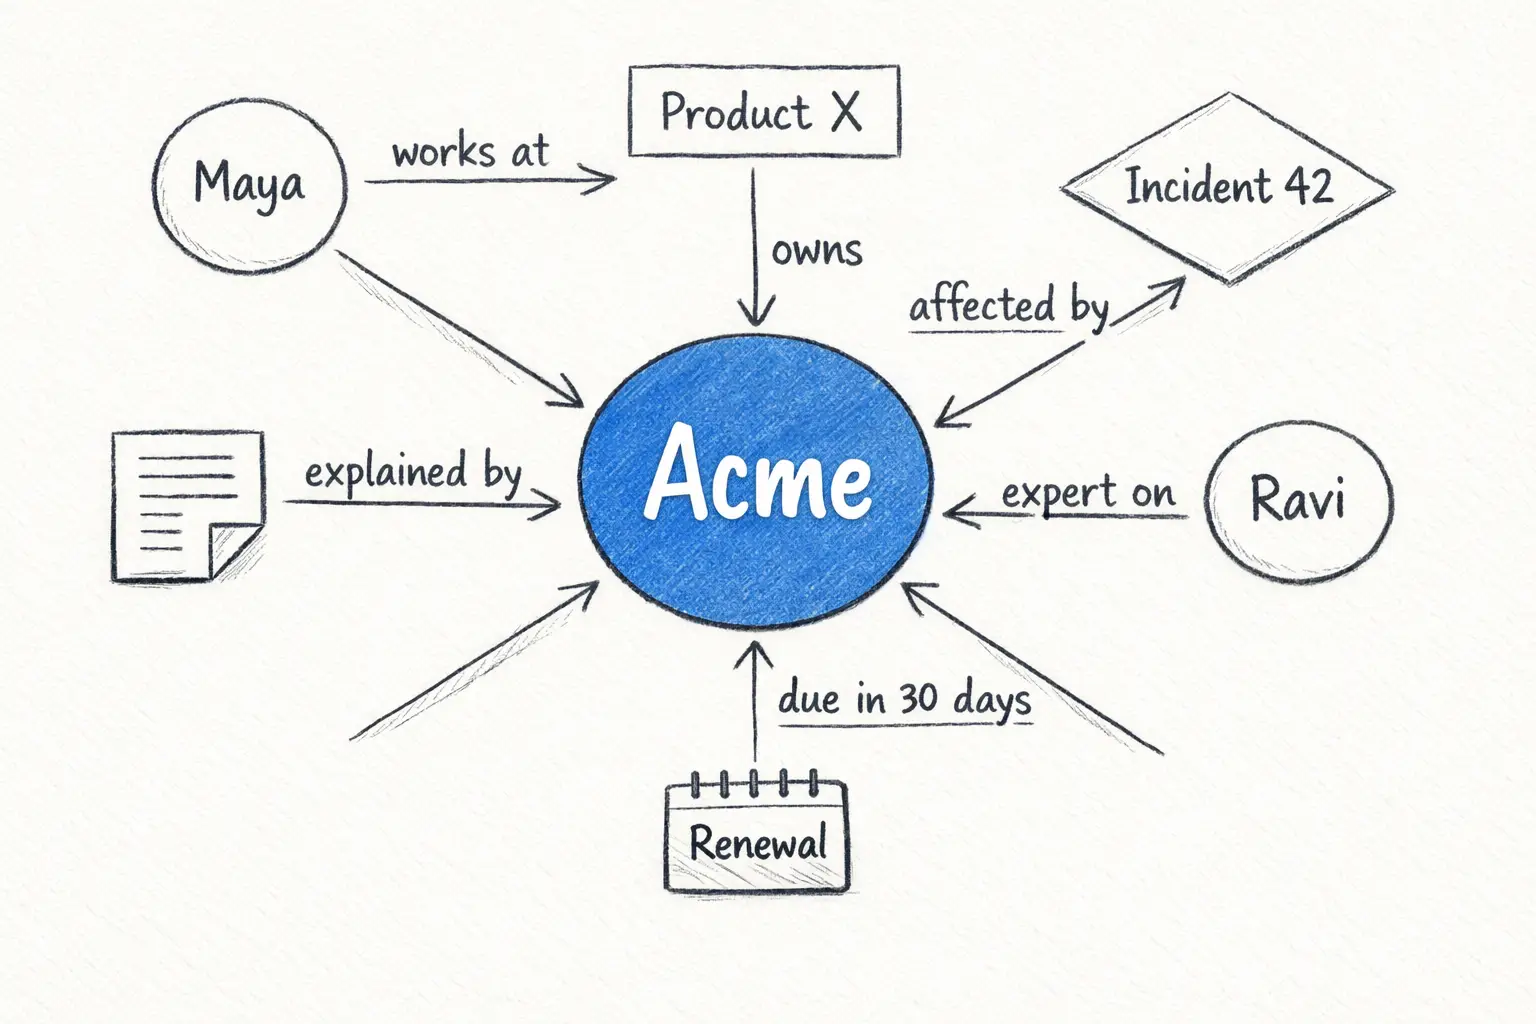
Consider a small service story involving Acme Corporation. The useful facts are spread across customer, product, support, knowledge, and employee data. Looking at the relationships as separate statements makes the shape of the problem easier to see:
- Acme Corporation owns Product X.
- Product X is affected by Incident 42.
- Incident 42 is documented in Knowledge Article A.
- Maya is a decision-maker at Acme.
- Engineer Ravi is an expert on Product X.
- Acme has a renewal in 30 days.
Each statement is simple, but their combined meaning is richer than any single record. Acme may be affected, the renewal makes the issue urgent, Maya is probably the right person to contact, Article A may contain the fix, and Ravi may be able to help. That connected picture is already more useful than six unrelated search results.
The only four terms we really need
The terminology can make this topic sound much harder than it is. For day-to-day understanding, four ideas are enough. Together they explain what is stored, how it connects, and why those connections have business meaning.
| Building block | What it means | Salesforce-flavoured example |
|---|---|---|
| Entity | A thing the business recognizes | Account, Contact, Case, Product, Asset |
| Relationship | How two entities are connected | Contact influences Opportunity |
| Property | A detail describing an entity or relationship | Case priority, contract start date |
| Meaning | The agreed business definition behind the model | What “strategic customer” or “owns” actually means |
The last row is what turns a collection of links into something closer to knowledge. “Maya is related to Acme” tells us almost nothing because she could work there, sell to the company, or support its users. “Maya is the economic buyer for Acme’s renewal” is precise enough to change what the sales team does next. The meaning of the relationship is not decorative metadata; it is part of the fact.
Three terms often appear around this idea. A taxonomy organizes concepts into categories or hierarchies, while an ontology defines the types of things, the relationships allowed between them, and sometimes the rules that connect them. The knowledge graph contains the actual entities and relationships that follow that model. Salesforce teams already make similar semantic decisions whenever they define what an Account represents, when a Lead becomes a Contact, what “Closed Won” means, or which system wins when two records disagree; the difference is that those decisions are not always captured in a form other systems can reuse.
The graph model can also be expressed as subject–relationship–object statements, commonly called triples: Acme owns Product X, and Product X is affected by Incident 42. The W3C Resource Description Framework standardized this linked-data pattern for exchanging and merging data even when the source schemas differ. The word “graph” does not mean a dashboard chart or a pretty network drawing, although diagrams are useful for showing a small part of one. A knowledge graph is the underlying data and meaning, and it is not automatically an AI model; knowledge graphs supported search, recommendations, fraud detection, and data lineage long before AI brought them back into fashion.
Is Salesforce already a knowledge graph?
Salesforce is not itself an enterprise knowledge graph, but it gives us an excellent head start. Objects, fields, lookups, master-detail relationships, metadata, sharing, and automation already form a connected application model. Give an experienced admin or developer an unfamiliar org and they will begin tracing those connections almost immediately.
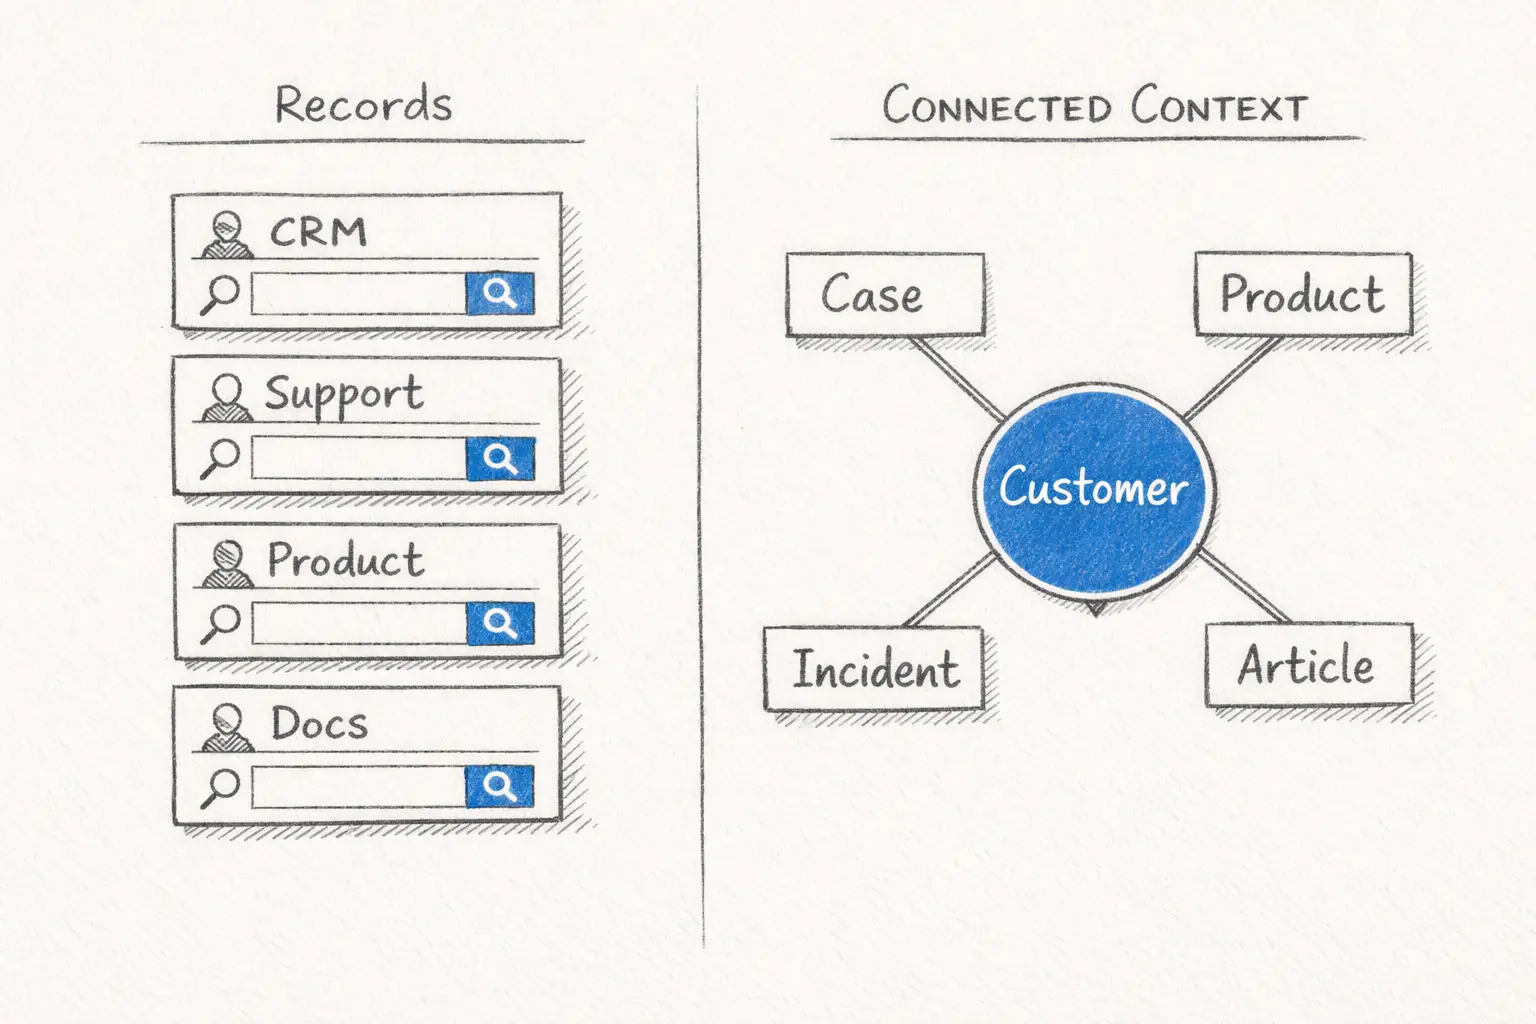
The org, however, is still one application model while the business is much bigger. An Account may also be a billing entity in ERP, a tenant in the product, a customer number in the warehouse, a website visitor in analytics, a company hierarchy in a third-party provider, and a party named in several contracts. A knowledge graph can connect those identities without pretending they are all the same record. The practical difference becomes clearer when the two views are placed side by side.
| Record-centric view | Knowledge-graph view |
|---|---|
| Starts with tables or objects | Starts with entities and meaning |
| Optimized for known application transactions | Optimized for connected context and traversal |
| Relationships often stay inside one schema | Relationships can cross systems and domains |
| Questions follow predefined joins and reports | Questions can follow changing, multi-step paths |
| Schema is usually designed application by application | Semantic model aims for shared business understanding |
A graph usually does not replace Salesforce or the relational databases around it. It sits across them as a shared context layer, allowing Salesforce to remain the place where sellers work and Cases move while ERP remains the financial source of truth. Search, analytics, employees, and AI can then use the graph to understand how facts from those systems relate.
What does a knowledge graph help us do?
The short answer is find and use context, especially when the answer is more than one lookup away. A service agent trying to connect a customer issue to a recent release may need to follow a path from Customer to Asset, Version, Release, Change, Known Issue, and finally the approved Article. “Multi-hop traversal” is the technical phrase for this, but the idea is simply to follow the business story until the answer appears. A lookup handles one hop well; a graph is designed to keep walking.
That ability is valuable because enterprise data rarely arrives with one clean, universal customer ID. The same company may appear as a Salesforce Account, an ERP customer number, a product workspace, a billing entity, and several email domains. A graph can preserve those identities, show why they are believed to belong together, and keep a link back to the source. This is more honest than flattening everything into one giant customer table and forgetting how each match was made.
Explicit relationships also make patterns easier to notice. Two incidents may affect products that share a supplier, several churned accounts may have been implemented by the same partner, or a high-priority Case may resemble earlier Cases resolved by one specialist. A consent rule might apply through a combination of region, product, and legal-entity relationships rather than through one field. The graph does not invent any of these facts; it makes the joins visible enough for people and systems to use them.
The explanation path may be the most important benefit for enterprise AI. If a system recommends engineer Ravi, users should be able to see that Ravi is certified for Product X, resolved three similar incidents, covers the customer’s region, and is currently available. That evidence is more useful than being told Ravi received a score of 0.87 because it can be checked, audited, and explained to the person making the decision.
Graphs also cope well with business models that refuse to stay inside their original boundaries. A subscription company may add usage pricing, a manufacturer may begin tracking components and suppliers, and a support organization may introduce partner-managed entitlements. Graphs still need a schema and disciplined governance, but a new entity or relationship is often less disruptive because the model grows around business meaning rather than only around a fixed table layout.
Where knowledge graphs shine most
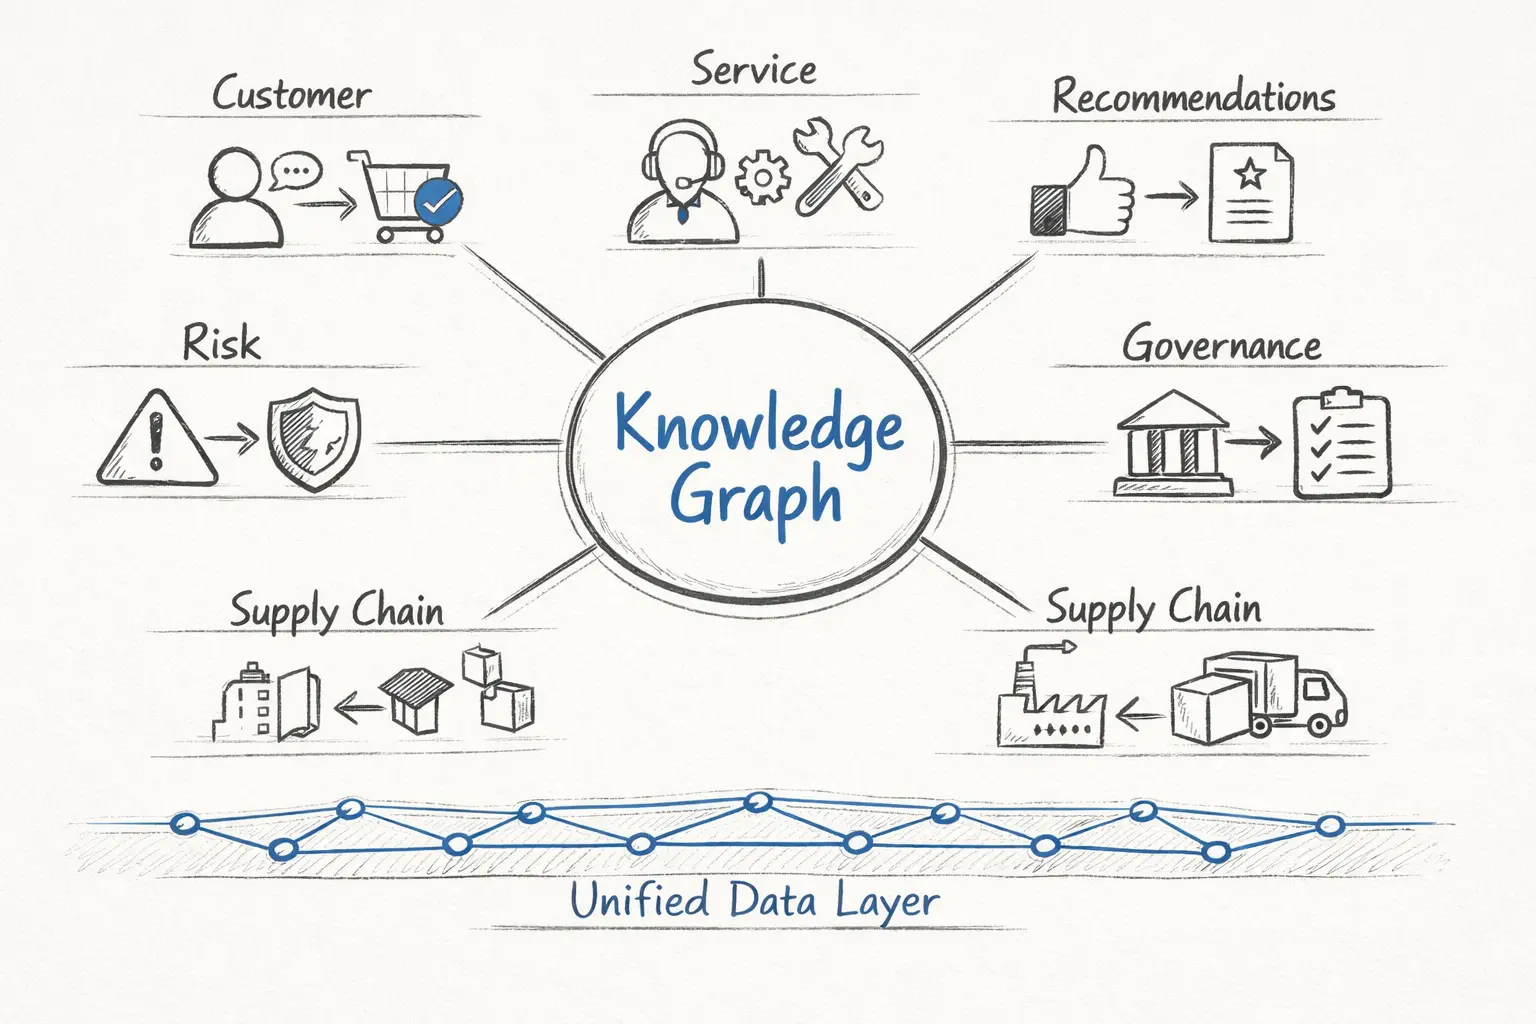
Knowledge graphs are not better at everything. They earn their place when the relationships matter as much as the records, and a richer Customer 360 is an obvious example. A typical Customer 360 assembles useful attributes such as industry, revenue, lifetime value, recent orders, open Cases, and engagement score. A graph-oriented view goes further by showing which people influence a buying decision, which subsidiaries share contracts or support dependencies, which Assets rely on affected components, which partners implemented the environment, and which employees already have trusted relationships with the customer. The profile tells us about the customer, while the graph shows where that customer sits in the business.
Service may be an even stronger use case because support is graph-shaped whether we model it that way or not. A problem connects to symptoms, Products, Versions, Assets, incidents, fixes, Articles, Entitlements, and experts. A service graph can help identify affected customers before they open Cases, find the most relevant resolution, route work to someone with proven experience, and explain why a suggested answer applies. It also helps when exact keywords fail: a customer may say “the checkout freezes,” while engineering calls the same problem “payment-session timeout after token refresh.” Semantic search can bridge the wording, and the graph can connect the issue to the affected version, customer Assets, and approved fix.
Recommendations improve for the same reason. “Customers who bought this also bought that” is useful, but it ignores compatibility, ownership, role, region, contract terms, prior interactions, product dependencies, and policy restrictions. A graph can bring those relationships into the decision so the recommendation becomes “this fits this customer now,” rather than merely “this item is popular.” The same pattern works when recommending knowledge Articles, next-best actions, experts, learning content, suppliers, or sales plays.
Fraud and risk are also difficult to understand one record at a time because the suspicious part is often the network. Accounts may share devices, addresses, payment instruments, directors, phone numbers, or unusual transaction routes while every individual record appears ordinary. A graph can reveal clusters, circular paths, and indirect associations that are hard to spot in isolated tables. The same approach supports cybersecurity investigations, access analysis, anti-money-laundering work, and third-party risk.
Developers may encounter knowledge graphs first through data governance rather than a customer-facing feature. Before changing a field, integration, policy, or data product, somebody eventually asks, “What will this break?” A metadata graph can connect business terms, fields, reports, APIs, transformations, owners, policies, and downstream consumers, giving architects a way to inspect the dependency path instead of asking ten teams and trusting whoever replies first.
Supply-chain and operational questions follow a similar pattern. A finished product may depend on components, facilities, suppliers, transport routes, regulations, and regions, so the useful question after a supplier failure is not which supplier record changed but what the disruption will eventually affect. Graphs are particularly good at tracing that blast radius across several layers of dependency.
When a knowledge graph is probably the wrong answer
Sometimes a knowledge graph is unnecessary. Plenty of business problems are already handled well by transactional systems, reports, search indexes, and relational databases. A graph should earn its operational cost rather than appear simply because the technology is fashionable. It is usually the wrong tool when:
- The workflow is straightforward and transactional.
- One object and a simple filter can answer the question.
- The primary need is regular aggregation over stable columns.
- The dataset is small and its relationships are shallow.
- An existing report, search index, or relational model already solves the problem clearly.
Adding a graph in those situations creates another system to operate without producing a better answer. It may duplicate data, complicate ownership, and introduce another place where information can become stale. Keeping the simpler model is often the better architecture decision.
Organizational readiness matters just as much as technical fit. A company that cannot agree on definitions, resolve duplicate identities, assign ownership, or maintain relationships will not gain knowledge by drawing more connections. It will produce stale links and vague labels, which amounts to confusion with nicer diagrams.
Having a lot of data is therefore not a reason to build a graph. A much stronger signal is that important questions repeatedly cross systems, take several relationship hops, and depend on understanding what those links mean. When those conditions are present, a graph may simplify a problem that has become awkward everywhere else.
Why should a Salesforce developer care?
This work is closer to a Salesforce developer’s day job than it first appears. We live in the awkward middle between business language and technical reality, turning words such as “customer,” “active,” “partner,” and “qualified” into objects, fields, relationships, permissions, rules, and automation. Every decision about whether something deserves an object, a field, a relationship, or a calculated value is already an act of domain modeling. A knowledge graph needs the same ability to turn an ambiguous business conversation into a precise model.
Graph thinking extends the questions we already ask. Does a concept have an identity of its own, and does the relationship carry dates, roles, confidence, or source information that deserves to be stored? Does the same concept exist in another system under a different identifier, is the relationship current or historical, and which system is authoritative when facts conflict? Access matters as well because seeing one entity does not automatically mean a user should be allowed to see every connected entity or inferred conclusion. These are familiar architecture problems for anyone who has untangled duplicate Accounts, historical roles, integrations, and sharing rules.
AI makes those modeling decisions more visible because a better prompt cannot rescue missing or unreliable context. Prompt engineering may improve the wording and behaviour of an answer, but it cannot determine which of three Acme records is the real customer, whether a contract is still active, which version of a policy applies, or whether the current user may see it. That quality comes from the data and relationship model. Building enterprise AI is therefore not only about calling a model or configuring an Agentforce action; somebody must decide what context reaches the model, which connections are trustworthy, and what the agent may do with the result.
Salesforce is also moving in this direction at the platform level. Its published Agentic Enterprise architecture includes a semantic layer and a centralized Enterprise Knowledge Graph connecting business entities across domains. The purpose is to let people and agents use the same understanding of what the company’s data means rather than forcing every application or agent to interpret it independently.
The product direction reinforces that architecture. Data Cloud was renamed Data 360, and Salesforce positions it as the unified, governed data foundation for Agentforce. Enterprise Knowledge for Agentforce Service became generally available in April 2026, bringing harmonization of siloed structured and unstructured content into Data 360. Salesforce also completed its acquisition of Waii in August 2025, with Waii’s metadata knowledge graph intended to help users and AI agents understand enterprise data across different sources and support language-driven exploration in Agentforce and Tableau.
None of this means every Salesforce org needs a graph database next quarter. It does signal that semantic modeling, connected metadata, identity, provenance, and graph-aware retrieval are moving closer to the centre of the platform. Developers who understand those ideas will be better prepared to shape the knowledge foundation behind applications, analytics, and agents.
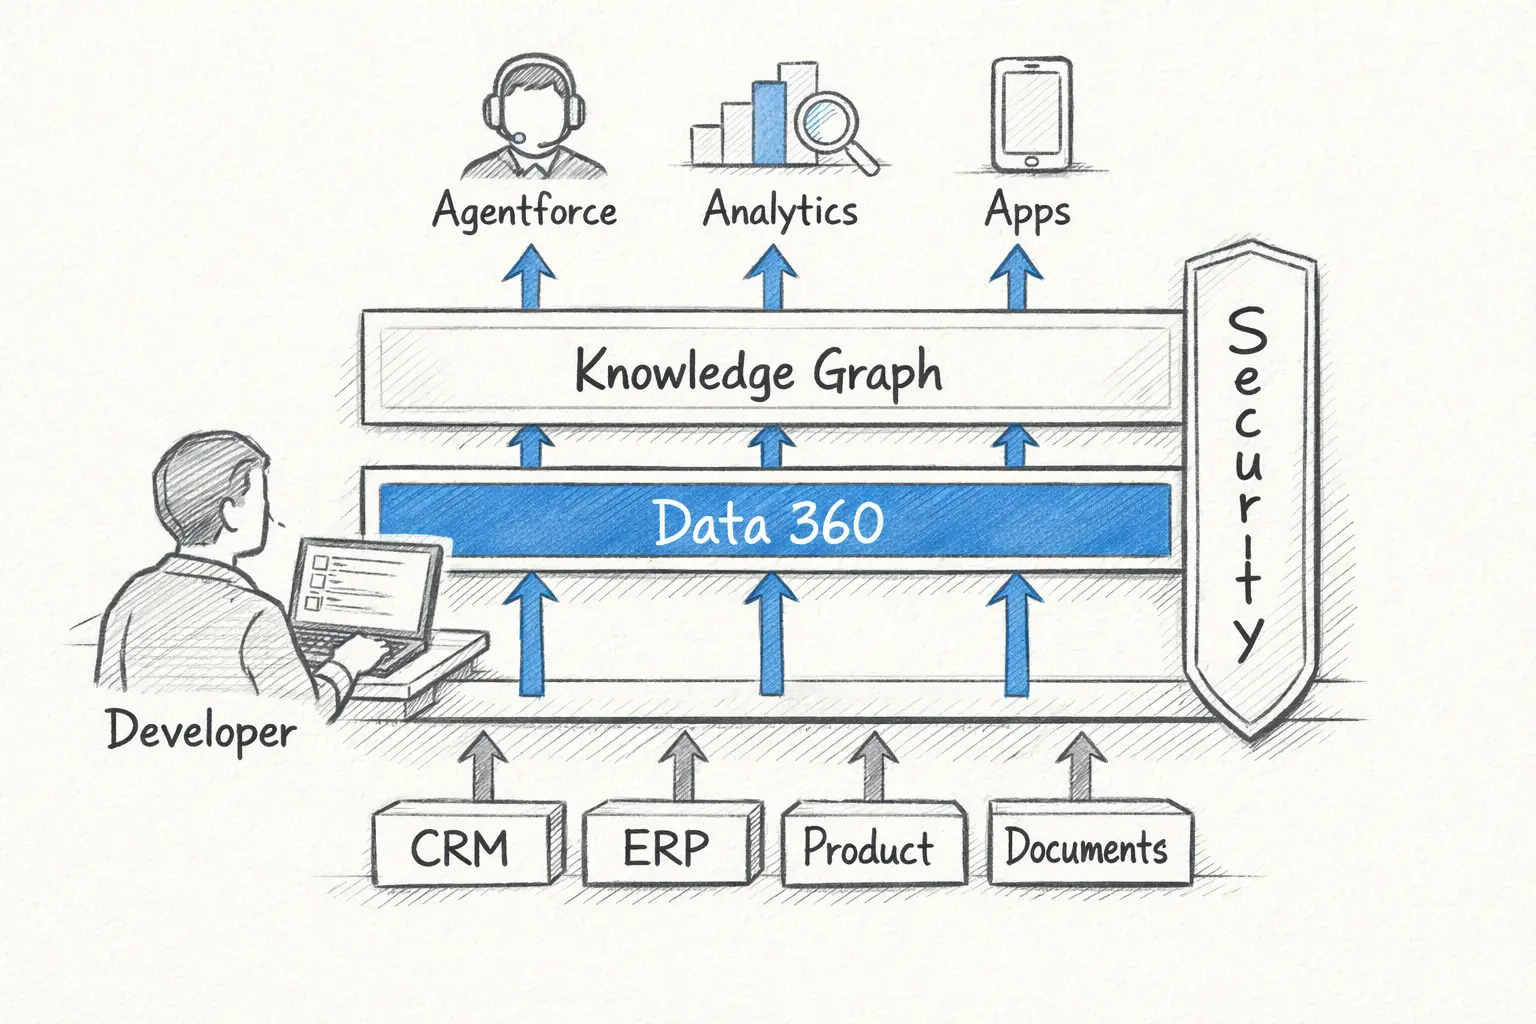
This mindset is useful even when the current project has no graph platform. Agentforce topics become clearer when business concepts and boundaries are explicit, actions become safer when identity and relationship ownership are known, and retrieval improves when content is connected to Products, audiences, Versions, and policies. Testing is also stronger when the expected evidence path has been defined, while explanations become more credible when they point back to authoritative facts. Learning to model context is therefore a better starting point than memorizing a graph query language.
Why is everybody talking about knowledge graphs now?
Knowledge graphs are decades old, but AI made them fashionable again by exposing the gap between sounding informed and knowing what is true inside one company right now. A language model can explain a renewal process beautifully without knowing that Acme’s contract changed yesterday, Product X is unsupported in one configuration, Maya moved from evaluator to economic buyer, or an approved policy was replaced last week. Those facts must come from enterprise data, metadata, rules, and permissions. Fluency cannot substitute for current business truth.
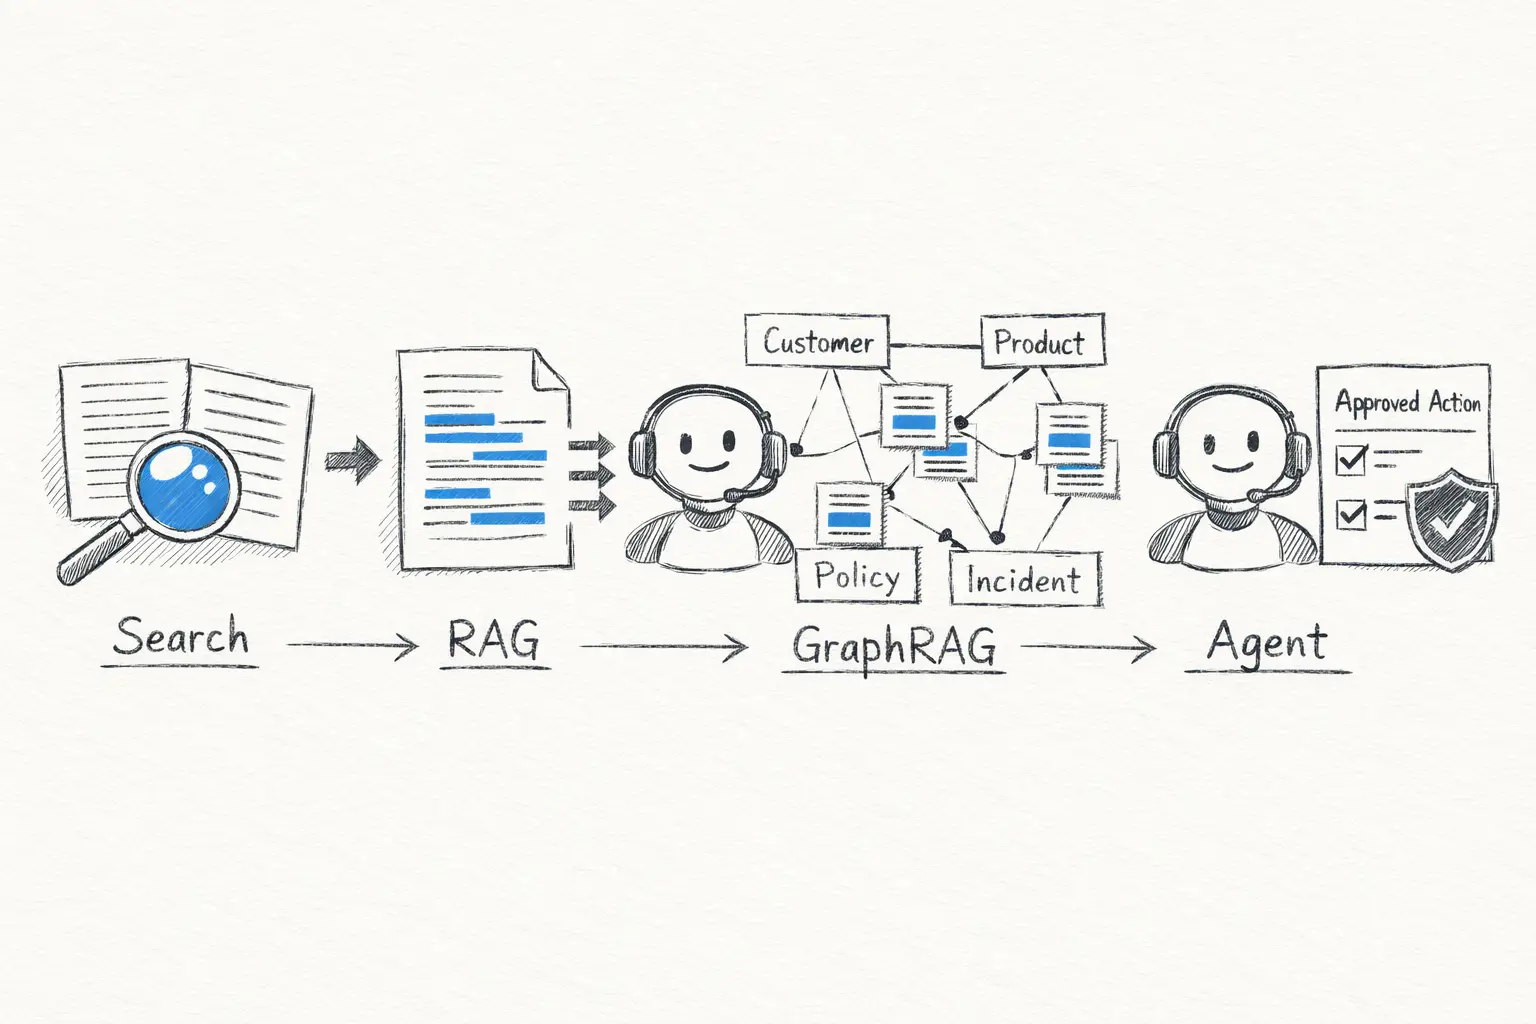
Retrieval-augmented generation, or RAG, was a major step forward because it searches approved content, retrieves relevant passages, and gives them to the model before it answers. That works well when somebody asks about a return policy and the correct paragraph contains the answer. It becomes less reliable when the question is which policy applies to this customer, Product, country, and contract date, or which incidents could explain symptoms across the Account’s installed Products. Questions about who can approve an exception or what downstream process will break after a definition changes also depend on connections rather than one similar passage.
Vector search and graph retrieval solve different parts of that problem. Vector search is very good at finding text that means something similar to the question, while a graph can follow explicit facts from a Customer to the Product, Contract, region, and Policy that apply. Most serious enterprise use cases benefit from combining the two rather than treating them as competing approaches.
| Capability | Vector retrieval | Knowledge-graph retrieval |
|---|---|---|
| Finds similar language | Excellent | Not its primary job |
| Follows explicit relationships | Limited | Excellent |
| Handles multi-step paths | Indirectly | Naturally |
| Preserves a reason path | Depends on implementation | Built around the path |
| Works with fuzzy wording | Excellent | Stronger when combined with semantic search |
This family of approaches is commonly called GraphRAG. Microsoft Research’s GraphRAG project combines text extraction, network analysis, prompting, and summarization to understand private text collections beyond isolated passages. GraphRAG is not one fixed architecture: some implementations build graphs from documents, while others connect an existing enterprise graph to retrieved content. The graph may expand a search, rank evidence, summarize related communities, or verify the path to an answer. Products use the name differently, but the useful idea remains the same: retrieve related context, not only similar text.
Agents raise the importance of that context because they do more than answer and wait. An agent may decide, call a tool, update a record, and continue into another system. A person can often notice a slightly odd answer, but an agent that chooses the wrong Account, Contract, Policy, or Product can carry the mistake into a business process before anyone sees it. The agent therefore needs a working model of the entities involved, how they connect, which facts are current, which source is authoritative, what the user may access, which actions are valid, and what evidence supports the conclusion.
A knowledge graph is not the agent’s brain; it is closer to a governed map of the part of the business where the agent is allowed to operate. That map also forces teams to confront differences in language. Sales may use “customer” to mean a legal Account with an active Contract, Marketing may mean any reachable person, Finance may mean the bill-to entity, and Support may mean the tenant that opened the Case. No amount of eloquence can resolve that disagreement. This need for shared meaning, more than the flashy demos, explains why semantic layers and enterprise knowledge graphs are back in the conversation.
A few traps I would avoid
A graph database and a knowledge graph are not the same thing. The database is technology for storing and querying connected data, while the knowledge graph is the model itself, including its identities, meanings, sources, history, and governance. Graph-shaped knowledge can be stored with different technologies, and an excellent graph database can still be filled with relationships that nobody understands or trusts.
AI can accelerate the work by extracting entities, suggesting relationships, classifying documents, and mapping sources. That can save a significant amount of manual effort, but a generated statement is not automatically an enterprise fact. Important relationships still need validation, ownership, confidence, a traceable source, and lifecycle rules. “The model found it in a PDF” is not a governance policy.
Trying to model the entire company before delivering value creates a different problem. A perfect enterprise ontology can consume months of discussion while the original business question remains unanswered. Starting with one useful question and the smallest connected area needed to answer it keeps the model grounded, and the graph can grow when a real use case demands more context.
More connections are not automatically better either. They can introduce noise, stale data, security exposure, and confused retrieval, particularly when every possible association is stored without deciding whether it helps a decision. The goal is not the largest graph but the smallest trustworthy one that improves the outcome.
How I would start—without writing code
Graph thinking can be tested before choosing a platform. Begin with a valuable question that is strangely difficult to answer today rather than with a database product. The question should expose whether the difficulty really comes from disconnected relationships, such as:
Which customers should we proactively contact about this incident, and which approved resolution applies to each?
If one report answers the question, build the report and stop there. If the answer crosses Customers, Assets, Products, Versions, Incidents, Entitlements, Contacts, and Articles, the problem is probably graph-shaped. The nouns in the question are possible entities, although not every field deserves to become a node. An entity should have some independent identity, relationships, history, ownership, or business meaning.
The connections should then be written as specific verbs. A Customer owns an Asset, the Asset runs a Version, the Version is affected by an Incident, the Customer holds an Entitlement, and an Article resolves the Incident. Repeatedly using vague labels such as “related to” usually means the relationship has not been understood well enough. A new team member should be able to read the verb and understand what the connection claims.
Every important entity and relationship also needs a source trail. The team should know where a fact came from, which system is authoritative, who owns its quality, when it was verified, whether it can expire, and whether its history must be kept. This trail is called provenance, but the habit matters more than the term. Without it, a believable answer and a trustworthy answer can look exactly the same.
Security belongs in the model from the beginning because relationships can expose sensitive information even when each record looks harmless on its own. Employment links, account hierarchies, medical associations, investigations, or inferred interests may become visible simply by following a path. Access control, purpose, consent, and classification must travel with the data, and an agent must not gain broader visibility just because the graph makes traversal easier.
A few expected answer paths can then become practical test cases. For the service example, a correct path might move from Customer to Asset, Version, Incident, and Approved Article. Testing that path shows whether retrieval used the right evidence, reveals broken relationships, and gives users a comprehensible explanation for the result.
The final measure should be the decision, not the size of the graph. Node and edge counts look impressive on a slide but say little about whether people find answers faster, Cases reach the right team, first-contact resolution improves, affected customers are identified earlier, or AI responses carry traceable evidence. A useful graph reduces manual impact analysis and improves a real workflow; otherwise, it is architecture without an outcome.
Questions that matter before implementation
When a real project arrives, identity and semantics matter more than the vendor logo. The team must decide how it knows that two records represent the same real-world entity, what every important relationship means, which source wins when facts conflict, and whether a relationship is current, historical, planned, or uncertain. It also needs to preserve where facts came from and how quickly changes must appear in the graph.
Security and operational quality deserve equal attention. Access to one node may not permit traversal to the next, incorrect entities and relationships need a correction process, and retrieval may need a deliberate mix of keyword, vector, graph, and hybrid search. The team must also decide which conclusions may trigger automation and which still require a human. Salesforce developers are well placed to ask these questions because we already know what happens when duplicate identities spread, sharing is added at the end, automation acts on stale data, or a field name hides a business argument nobody settled.
Final thoughts
Businesses do not operate as rows; they operate through relationships. Customers belong to groups, people play different roles, Products depend on components, Cases resemble earlier incidents, Policies apply under specific conditions, and Documents replace older Documents. The useful context is found in that network rather than in any one record.
LLMs made knowledge graphs fashionable again because fluent AI exposed how disconnected enterprise data really is. RAG helped models find relevant text, while graph-based context helps them follow how the relevant things fit together. Agents raise the stakes because they do not only answer questions; they act on the context they receive.
For Salesforce developers, the opportunity is not to chase a fashionable database but to become good at designing the context layer between business data and intelligent action. Start with one awkward, relationship-heavy question, name the entities, make the connections specific, track the source, respect security, and test the evidence path. A knowledge graph then stops looking like an exotic AI idea and starts looking like the map our business systems were missing.